Why and How Critical Conflicts are Essential for Improving Network Screening Efforts
Network Screening is an Essential Component for Creating Safe Highway and Street Networks
Network screening is a process of identifying and stratifying road sites with safety issues and prioritizing the list of sites requiring in-depth investigation and safety treatments. This process involves scanning highway and street networks using reliable information about road user operations and risks to identify sites where safety improvements will yield significant benefits. In the interest of efficient expenditure of public funds, highway agencies must optimize their safety investments. They are faced with decisions on where and what type of investments will deliver the largest benefit. Thus, network screening is the first step in managing a highway safety improvement program to identify sites for potential investments.
Screening can be done to identify hot-spots and locations driven by a system-wide safety improvement perspective. Network screening produces a list of sites that are ranked by priority for subsequent engineering studies. In turn, cost-effective projects are formulated from the studies with the intent to save the most lives and prevent injuries. There are several different network screening methods in use today. Some have been used for decades in mostly a reactive manner, while others have recently emerged and show significant promise. The more advanced methods examine how costs and benefits of projects can be assessed at the time of screening. Below is a brief presentation of some of these methods.
Network Screening using Crashes
Traditionally, agencies have relied on using historical crash data to identify which locations deserve priority for safety improvements. Many agencies have identified their sites with high injury potential in their networks using crash data. The use of crash data for such purposes, however, is problematic for some notable reasons as explained below.
It is well established that crash frequencies naturally fluctuate over time even without any changes being made at a highway segment, intersection, or other site type. Statistically, the randomness of crash occurrence indicates that short-term crash frequencies are not a reliable estimate of the true underlying safety performance of a site. Regression-to-the-mean (RTM) bias is also inherent in the variation of crash data. Moreover, crash data suffer from being outdated, inaccurate, incomplete, and prone to underreporting especially for pedestrians, bicyclists, and other active transportation users. Further, using data about crashes to prevent future deaths and injuries presents a moral dilemma (i.e., waiting for these tragic events to occur), a significant drawback of “reactive” methods for managing safety.
Crash-based methods in the Highway Safety Manual (HSM)[1] have endeavored to overcome some of the above limitations and addressed specific statistical issues such as regression-to-the-mean (RTM) bias, for instance, by combining estimates of crashes from models with an estimate using observed crash history. Nevertheless, it is still challenging for many agencies to use the HSM due to the comprehensive data requirements and the calibration process that is involved. Coupled with other significant limitations of using crash data and the ethical dilemma of reactive processes, the alternative methods of proactive network screening become highly desirable.
Network Screening using Roadway-Features
The roadway features-based methods of network screening rely on design features and operating conditions to rate the safety of traffic sites. One example is the United States Road Assessment Program (usRAP) which uses a rating system from 1 to 5 scale to rate the safety of a road segment according to several design and operating elements. This approach is proactive in that it does not rely on crash data to make a safety assessment and allows agencies to proactively improve sites with an expected below-average safety performance in the future. The usRAP tool prepares a “safer roads investment plan” through an analysis of approximately 70 possible engineering treatments and crash countermeasures that might be considered for the segment in question, and a rank-ordered cost-benefit list of each. This tool presents results that are easy for agencies to understand and implement.
Nonetheless, the data requirements for agencies to use such tools are significant, and the underlying algorithms rely heavily on statistical models based on the relationship between roadway and traffic elements and crash data (limitations already noted). Some of the roadway and volume data likely exist in agencies’ roadway or geographical information systems; however, a lot of the data elements must be collected through coding from Google Street view, technologies used in the field, or from other sources. A significant limitation of this approach is that it lacks the contextual, operational conditions associated with high-risk events. For example, this approach cannot answer when active travelers are most vulnerable at the site such as during peak periods, weekends, or night-time conditions. Similarly, they cannot illuminate when, where, or how heavy vehicles might be increasing injury risk for other road users at the ranked sites.
Network Screening using Critical Traffic Conflicts
The United States Department of Transportation’s National Roadway Safety Strategy (NRSS) outlines the department’s comprehensive approach to significantly reduce serious injuries and deaths on our nation’s highways, roads, and streets. The foundation of the NRSS revolves around the Safe Systems Approach. Six principles form the basis of the Safe Systems approach: deaths and serious injuries are unacceptable, humans make mistakes, humans are vulnerable, responsibility is shared, safety is proactive, and redundancy is crucial.
Traffic conflicts-based safety analysis methods are proactive and are being increasingly adopted by agencies in many countries including the U.S., Canada, Australia, and New Zealand. Critical traffic conflicts are conflicts with indicator values such as Time-to-Collision (TTC) below or at their respective thresholds. Along with near-misses, critical conflicts occur far more reliably than crashes, and over the past decade have been proven as a strong predictor of future crashes, replacing the decades long reliance on traffic volumes as the single best predictor of future crashes[2,3,4,5]. Traffic conflict-based methods have been primarily used at individual locations and corridors. However, with the advent of video analytics that use the advantages offered by artificial intelligence and big data analysis, traffic conflict methods can now be scaled up to the network level.
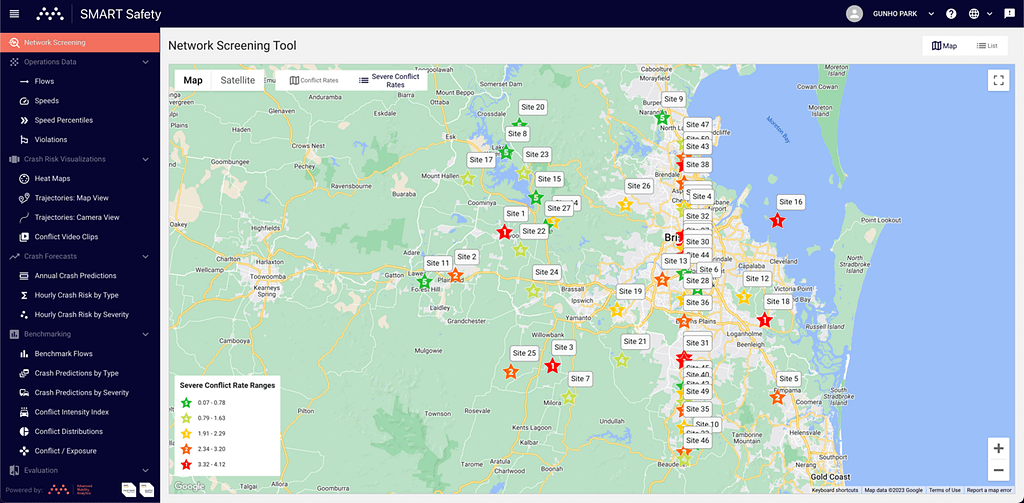
Video-monitored locations across a network can receive a relative safety rating based on conflict metrics that are shown to be related to crash risk. As an example, Figure 1 shows 50 sites at the network level on a map with their severe conflict rate ratings on a scale of 1 (worst coded as red) to 5 (best coded as green). The sites with the lowest ratings should be given priority review first to determine what potential exists for safety improvements to be implemented in a cost-effective manner. By benchmarking across numerous ‘similar’ sites, and with the ability to focus on the operational and risk context of all road users, critical conflicts provide insights that neither crash data nor infrastructure safety ratings can match.
When deployed at an adequate number of high-risk locations and using correctly applied conflict metrics and reliable AI model, analysis of video-collected critical conflicts is more comprehensive and equitable across road users than current reported crash histories or infrastructure-based ratings. There are numerous reasons for this as noted below:
- Video analytics not only provided insight into crash risk via critical conflicts, but also deliver a vast array of operational metrics like average and percentile speeds, flows, and violations by time of day, that collectively provide a complete picture of the exact operational and risk profile for all road users at a location.
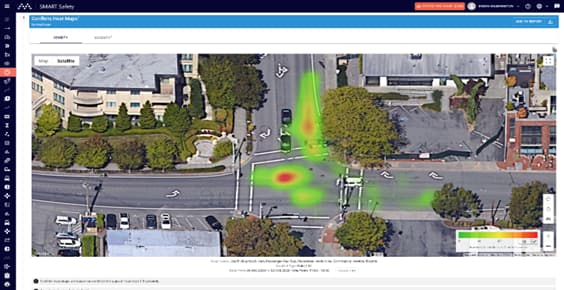
- Critical conflicts integrated over time into crash risk heat maps provide unprecedented insights into site safety by revealing both when and where crash risk by type is present and for which specific road users (see Figure 2).
- Heat maps can also be generated using proactive indicators of crash severity such as expected Delta-V[2,3,5], providing a heat map that shows only those critical conflicts that are likely to result in crashes with serious injury consequences. Since reducing injury severity is one of the explicit goals of the Safe System approach, this ability will be a positive “shot in the arm” for road agencies that typically have to wait longer for severe crashes to occur.
- Road user trajectories obtained from video analytics can be helpful for assessing and diagnosing safe operations of a site, providing insight into typical pathways or ‘desire-lines’ of user movements. These trajectories highlight both safe and high-risk paths of road users. As examples, tracking pedestrians that repeatedly walk outside a marked crossing or bicyclists that ride wrong way on a section of road yields insights that would never be revealed using crash histories or assessment of highway features and characteristics.
- Normalization of critical conflict metrics is essential to fairly compare operational and safety performance across network locations. Since critical conflicts are non-linearly related to crashes, the exact relationship between conflicts and crashes is needed, along with normalized critical conflict metrics. As specific examples, these metrics can include conflicts/exposure, annual and hourly conflict-based crash predictions, and conflict intensity index, which provides the relative crash risk for road users relative to their proportion in the traffic stream. These normalized metrics combined with other operational and risk insights provide unparalleled insight into network level risk.
Video derived critical conflict-based network screening methods are not without their limitations. First, as these methods are emerging, and artificial intelligence (AI) algorithms for processing video are readily available, it is relatively easy to build and market AI based analytics algorithms where models are inaccurate, unreliable, and produce poor flows; inadequate detection of road users; inaccurate speeds, and large number of false positive and false negative conflicts. The lack of market maturity, understanding, and validation of these technologies also means that consumers may have a challenging time separating quality products from inferior ones. There is the associated risk that inferior products will tarnish the industry and impede uptake of this promising technology.
Second, video quality must meet a higher input quality standard (e.g., high-definition resolution, 15 or greater frames per second, etc.) to deliver reliable critical conflicts than what has historically been required to reliably count and classify road users (either using AI or manually). As numerous jurisdictions possess legacy hardware that is insufficient for reliable conflict-based analysis or have been operating capable hardware at less than optimum performance, field-deployment of infrastructure must be improved before rolling out video analytics-based network screening in many jurisdictions.
Third, while it is generally true that about 20% of network locations represent 80% of network crash risk, camera infrastructure is not present ubiquitously across most networks. The use of temporary cameras can be used to cover sites not covered by fixed cameras, but jurisdictions will need to plan for effective coverage and impact of their camera deployments to have maximum impact. In addition, existing pan-tilt zoom cameras, which are underutilized for a significant portion of the time, should be better leveraged to support conflict-based analyses. Finally, overcoming the inertia of legacy approaches in risk-averse government agencies is challenging. The profession thus must rely on the most agile and innovative agencies to lead the way forward.
The Future of Network Screening
Different methods can be used for the critical task of network screening, each having their advantages and disadvantages as described previously. They should be seen to complement one another and serve as decision making tools for safety professionals on where to invest funding. It is important for agencies to guard against misallocation of resources when using a particular method(s) to ensure precious safety dollars are invested carefully.
The traditional use of historical crash counts can lead to misallocation and agencies can miss opportunities to save more lives and prevent injuries. The significant global support for the Safe Systems approach points to a greater use of proactive methods and less reliance on historical crash data. This approach represents a shift away from ‘conventional and reactive’ because it focuses on both human mistakes and vulnerability, identifies risks before crashes occur, and designs a system with many redundancies in place to protect everyone. Conflict-based methods through video-analytics offer a range of significant advantages over legacy methodologies. These methods are mature enough today to start delivering measurable reductions in injuries and fatalities on our networks but generally not understood well enough by an average government agency to distinguish between the differences in product quality, features, and reliability. Collectively, the leading video-analytics providers and government agencies who recognize the enormous potential for achieving Vision Zero will drive this technology forward, spread case-studies of success, and facilitate the transition from legacy, reactive approaches that fail to fully deliver on the collective Vision Zero promise.
References
- Highway Safety Manual, 1st Edition, Volume 1, 2010. American Association of State Highway and Transportation Officials.
- Arun, A., Haque, M. M., Bhaskar, A., Washington, S. & Sayed, T. 2021. A bivariate extreme value model for estimating crash frequency by severity using traffic conflicts. Analytic Methods in Accident Research, 32, 100180.
- Arun, A., Haque, M. M., Bhaskar, A., Washington, S. & Sayed, T. 2021. A systematic mapping review of surrogate safety assessment using traffic conflict techniques. Accident Analysis and Prevention, 153, 106016.
- Arun, A., Haque, M. M., Washington, S., Sayed, T. & Mannering, F. 2021. A systematic review of traffic conflict-based safety measures with a focus on application context. Analytic Methods in Accident Research, 32, 100185.
- Arun, A., Haque, M. M., Washington, S., Sayed, T. & Mannering, F. 2022. How many are enough?: Investigating the effectiveness of multiple conflict indicators for crash frequency-by-severity estimation by automated traffic conflict analysis. Transportation Research Part C: Emerging Technologies, 138, 103653.

