These proactive solutions offer the promise of using surrogate measures* of safety, rather than crashes, to inform and guide how you invest in safety and make decisions to improve safety on your roads.
* Surrogate measures mean there is a correlation between the data and the expected outcome but it is not guaranteed.
These critical conflicts or events are measured using generally unfamiliar metrics that are put forward without a clear understanding of what they really are, how they relate to crashes, and what we should expect them to look like.
After all, there’s a big difference between the casual observer and AI. We’ve shared articles before, focusing on what conflicts are and how we measure them. This article is here to provide some background and show you what to expect when you observe these critical conflicts.
What are critical conflicts?
So, what are critical conflicts? And why do we use these to inform road safety?
It has been suggested that, “For every passage of a motorist within the domain of a traffic facility, there is a chance set up for a collision to take place.” – Hauer
Building on this, each passage taken by a road user can be seen as a trial with a non-zero underlying chance of failure. It means that, no matter what, there is always a chance of a collision — even if the incident hasn’t happened yet.
In each of these circumstances, there is a precise mechanism that exposes the road users to the risk of collision. The problem is that the mechanism is not directly observable and can only be inferred from empirical realizations in the form of road collisions or critical conflicts.
There is no clear definition of what constitutes a trial – however, every road user travelling on a section of road is a reasonable starting point.
It can be argued that a genuine trial must entail a reasonable chain of events that present a reasonable chance of a collision taking place. So, a direct way to measure exposure is by tracking conflicting road users objectively and consistently across a period of time.
Without the use of a tracking mechanism (e.g. the aid of accurate, reliable, objective computer vision) to identify conflicting road users, this aspiration is very difficult at best, and impossible at worst.
In a previous blog, we discussed how to measure critical conflicts. It’s important to remind ourselves, however, how they relate to actual crashes. To understand what a critical conflict is, there’s a pyramid that represents the interactions of road users.
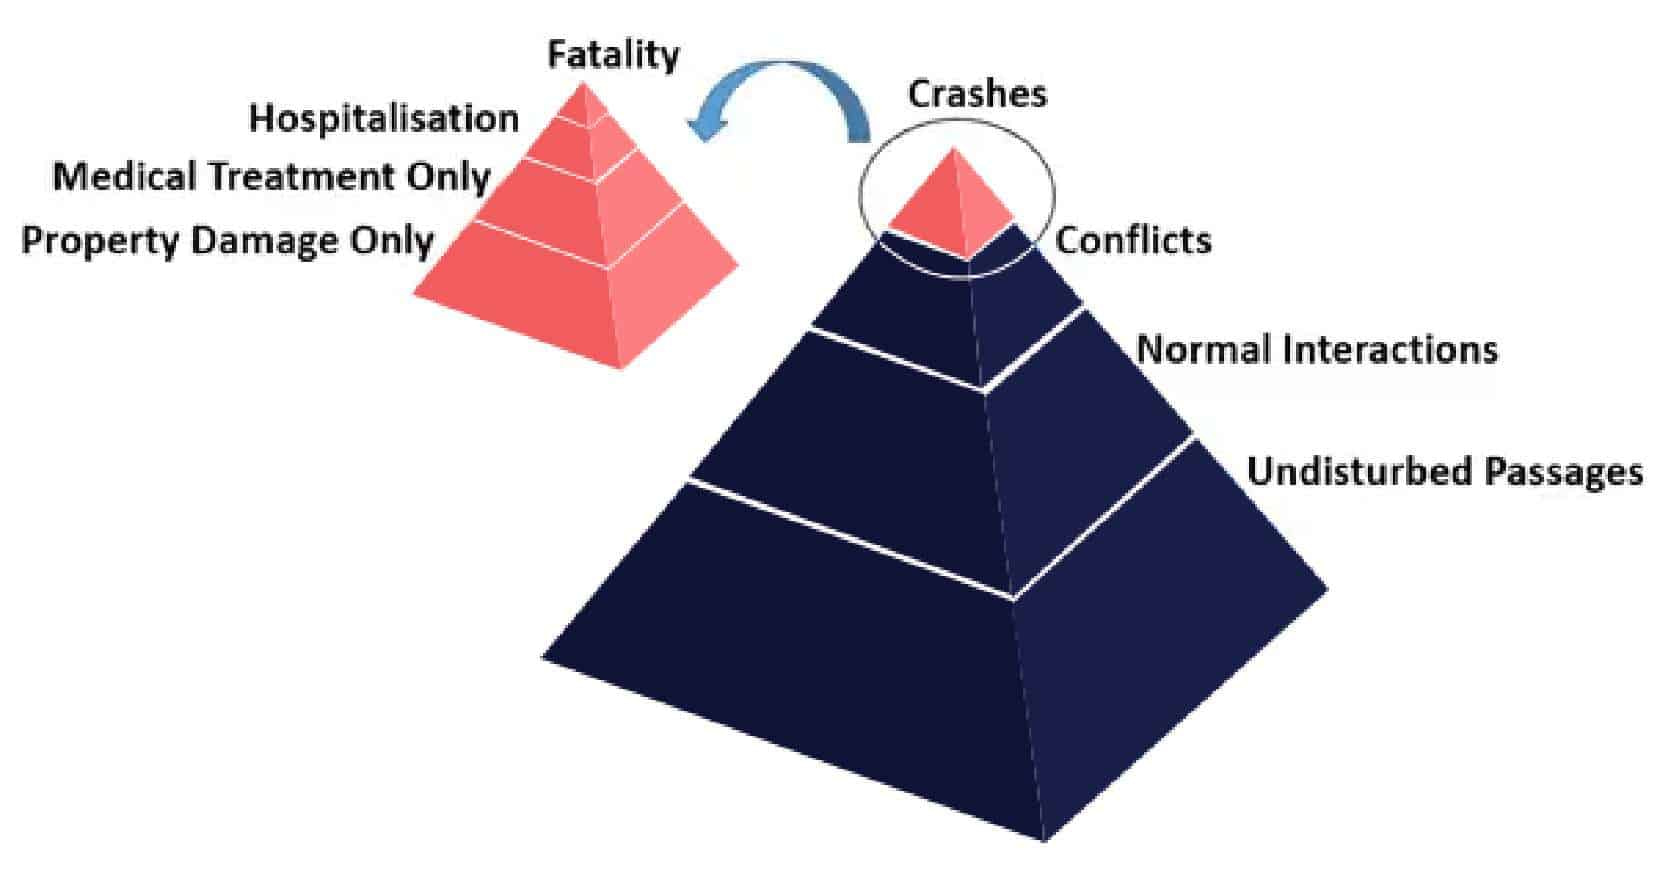
The red tip of the pyramid represents the very small fraction of interactions where the outcome is a crash. The red portion of the pyramid represents fatal crashes that are most severe and least common, followed by serious injury crashes, minor injury crashes, and property damage crashes.
The next segment of the pyramid represents the proportion of all interactions that result in serious traffic conflicts (i.e. critical conflicts), followed by light traffic conflicts, normal interactions, and undisturbed passages.
With this model of road user interactions, we can draw some useful observations that help us understand the role of critical conflicts in understanding and measuring the risk of crashes.
The higher up in the pyramid, the less often these events are observed. So, for example, serious traffic conflicts are more common than property damage crashes, and far more common than fatal crashes. Undisturbed passages are most common.
For each fatal crash outcome that occurs, we might observe as many as 5,000 or more critical conflicts, and for each crash resulting in minor injury, we might observe 50 critical conflicts.
Armed with this background information, we can define a traffic event as a situation where road users come within reasonable temporal and spatial proximity to each other.
In most traffic events, a serious effort —an evasive action (e.g., braking or swerving) with adequate magnitude — is made to avoid a collision. These events are defined as near-misses or critical conflicts.
If the strength of the evasive action is not adequate to avoid physical contact with the interacting road users, they will collide or come into physical contact. However, problems arise due to an inconsistent definition of what “evasive actions” are and when they are commenced.
On top of this, it is sometimes difficult to differentiate evasive actions from normal adaptations of the position and velocity of one road user while navigating a traffic stream. As a result, it is important to recognise that some critical conflicts are easily recognisable whilst others are not. With an understanding of what critical conflicts are, we turn now to the question of how they are related to actual crashes or road user safety.
How are conflicts related to crashes?
In one of our previous articles, Co-Founder, Tarek Sayed laid out the fundamentals for accurately measuring conflicts and how these conflicts are quantified and statistically related to crashes.
In summary, the relationship between conflicts and crashes, while reliable and repeatable, is complex. It requires numerous, well-designed and measured metrics, and varies from city to city.
The findings from examining these relationships are not too dissimilar to the efforts focused on understanding the relationship between crashes and traffic volumes — which has been the focus of considerable research for several decades.
To understand how these conflicts relate to crashes, we briefly review the statistical relationship and then focus more on the theoretical. Statistically, critical conflicts are non-linearly related to crashes. In the plot below, crashes on the Y-axis increase with the number of observed critical conflicts on the X-axis, although as X increases more, the Y increases at a slower rate.

Of course, this statistical relationship varies across regions, states, and countries. It’s similar to the relationship between road user exposure and crashes — the greater the number of road users in general, the greater the expected number of crashes.
However, research has shown that critical conflicts are more reliable predictors of crashes than road user exposure. It is important to note that this relationship between conflicts and crashes varies by crash type, conflict type, and across jurisdictions; thus, local calibration of models predicting crashes using conflicts is important (as discussed in our previous article).
This relationship between conflicts and crashes can also be explained from a theoretical, or causal process. James Reason’s Swiss Cheese Model of crash causation has withstood the test of time and serves as a very useful model for understanding how critical conflicts are causally related to crashes. This model, shown below, suggests that crashes (not conflicts) occur from a multiple failure mechanism, not just a single point of failure.
It means several events need to “go wrong” for an actual crash to occur.
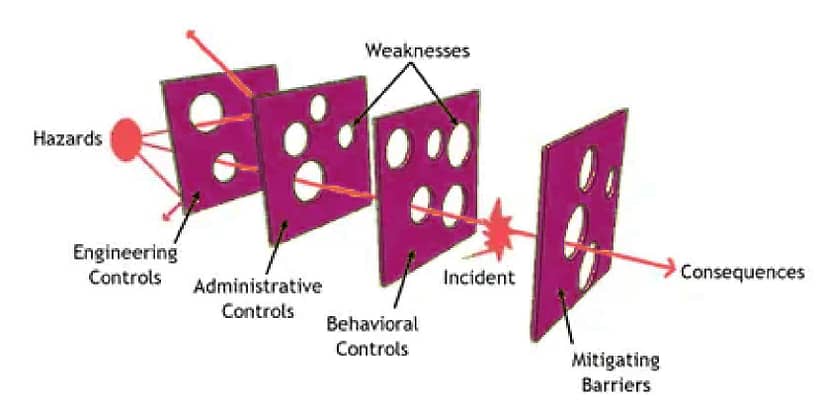
In general, a crash occurs when engineering controls in place fail (e.g. a driver runs a red light or lane striping becomes faded), and administrative controls fail (e.g. scheduled maintenance failed to remove loose debris from the pavement), and behavioural controls fail (e.g. enforcement presence insufficient to prevent speeding).
The severity of the crash will also be influenced by mitigating factors (or barriers), such as the type of safety equipment in a vehicle and the eventual angle of collision.
It’s important to note that the Swiss Cheese Model represents a time sequence of events, where the subsequent control weaknesses are aligned in such a way as to result in a crash.
This misalignment is quite rare — it sits in the red portion of the pyramid. The controls in place are usually sufficient to produce mostly normal interactions among road users.
So, how is a critical conflict explained by the Swiss Cheese Model?
Essentially, a critical conflict represents a case where one or two of the three control weaknesses were revealed, but at least one control prevented a crash. To illustrate, let’s examine some hypothetical scenarios.

A driver enters an intersection heading northbound at excess speed. Another road user, making a turn onto the northbound direction, misjudges the available gap to enter the road (expecting the approach speed to be lower), and enters the same lane. Thankfully the speeding driver is paying attention, cannot change lanes due to adjacent traffic, and brakes aggressively to avoid a crash, coming within several meters of a collision.

A pedestrian enters a marked crossing against the Don’t Walk signal. Fortunately, an approaching driver needs to only slow slightly to avoid colliding with the pedestrian. Their paths cross within 1.0 seconds of each other.

A car is following a large commercial vehicle ahead of it too closely. Because of restricted forward visibility, the car driver veers towards the curb to improve visibility and sees a cyclist on the shoulder fast approaching. The car swerves at the last second and avoids a collision with the cyclist.
Across these three examples, two of them involved evasive actions (heavy braking and swerving). The events involving evasive actions would be easy to detect, however, the second example may not appear remarkable in any way. What each of these examples has in common is that they are one perception and reaction away from a crash. If any of these drivers were distracted, not paying attention, or were fatigued, then a crash would have occurred
Hypothetical events and events like these can occur as much as 200 to 500 times for each crash and in a non-linear fashion.
It is this relationship, and the ability to observe these critical conflicts, that facilitate the implementation of proactive safety methods. A ‘heat map’ that shows a large number of similar conflicts is an indicator that with time, some of these conflicts are likely to result in actual crashes.
Putting it all together: What do we expect critical conflicts to look like if we were to see or record one?
Firstly, it’s important to note that what can be computed with the aid of video analytics is far more detailed than can be seen with the naked eye.
Accelerations, decelerations, trajectory, speeds, and seconds to impact can be measured precisely with video analytics. Because critical conflicts can be visually saved and replayed (e.g. shown on a 10-second video clip of an intersection), many people have preconceived ideas of what they should expect to see.
Crashes are obvious to anyone who can see one. But critical conflicts are much more difficult to discern because:
- There are numerous metrics used to define them, many of which do not lend themselves to visual verification.
- Some conflicts do not involve aggressive evasive actions
- It is not always obvious how ‘close’ to a crash the conflict was.
The presence of aggressive, abrupt, or ‘obvious’ evasive actions enables critical conflicts to be easily identified and/or noticed in a video clip.
Squealing tires and swerving vehicles are events that stand out from the ‘normal’ set of interactions among road users. These events are unnerving video clips to observe.
Of course, if you were to look at the marketing materials for providers of video analytics, they will typically show a very impactful evasive action for a near-miss that will make you want to take your teenager’s car keys away.
These critical conflicts, however, are not the norm. Such events are only a small subset of critical conflicts that are needed to predict crash risk — and other less obvious critical conflicts are equally worrisome.
The absence of aggressive evasive action in a critical conflict does not make it less powerful for reliably predicting crashes. It does, however, make the critical conflict look less remarkable from an onlooker’s perspective. These events can look seemingly normal in video clips, despite their relationship to crash risk.
So, what is a critical conflict, if it may not be easily observed?
A critical conflict is a carefully screened and empirically-validated set of circumstances, that, when repeated enough times, will eventually result in a crash. These critical conflicts possess a number of, but not all ‘ingredients’ that are essential for a crash to occur.
Examples of ingredients that create critical conflicts:
- Excess speed
- Improper tracking (e.g. position in a curve
- Aggressive gap acceptance or lane changing
- Following too closely
- Poor judgment (e.g. misjudging the speed of a vehicle, size of a gap, etc.)
- Poor execution (e.g. stepping on accelerator instead of brake).
By carefully measuring and tracking these critical conflicts, and their essential ingredients, our profession can and will evolve from relying on actual crashes to inform safety management.
Significant work remains in refining the conflict metrics that matter most, scaling these conflicts across jurisdictions, measuring evasive actions, and developing increasingly reliable metrics.
A critical conflict is a carefully screened and empirically-validated set of circumstances, that, when repeated enough times, will eventually result in a crash. These critical conflicts possess a number of, but not all ‘ingredients’ that are essential for a crash to occur.
Examples of ingredients that create critical conflicts:
References
1. Ismail, K., Sayed, T., and Saunier, N. (2011) “Methodologies for Aggregating Indicators of Traffic Conflict”, Transportation Research Record: Journal of the Transportation Research Board, Vol. 2237, pp. 10–19.
2. Zheng, L., Sayed, T. and Mannering, F. (2021) “Modeling traffic conflicts for use in road safety analysis: A review of analytic methods and future directions”, Analytic Methods in Accident Research, Vol. 29, 100142.

